Inequality symbols are mathematical signs used to compare two numbers, quantities, or expressions. Unlike an equals sign, which shows that two values are exactly the same, inequality symbols can show that one value is smaller, larger, or simply different from another.
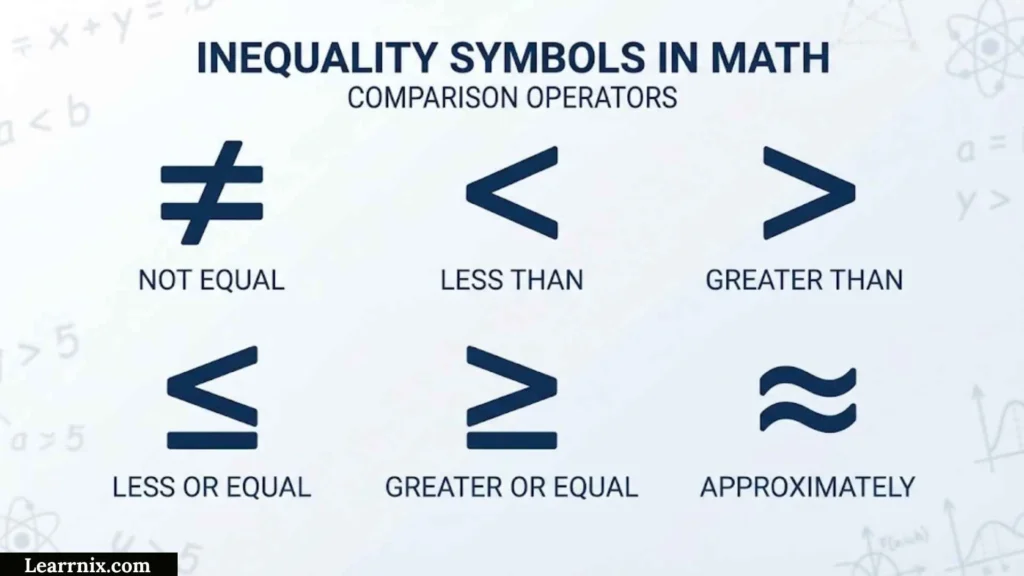
The most common inequality symbols are <, >, ≤, ≥, and ≠. Each has a specific meaning, and knowing the difference helps you read mathematical statements, solve inequalities, understand word problems, and create accurate graphs.
This guide covers inequality symbols from the basics to practical use. You will learn their meanings and definitions, see examples and charts, understand number-line graphs, learn when to use open or closed circles, and find copy-and-paste inequality symbols for everyday use.
What Are the Inequality Symbols
Inequality symbols compare two values when the relationship is not necessarily equality. The five most commonly used symbols are:
| Symbol | Name | Meaning | Example |
| < | Less Than | The left value is smaller | 3 < 8 |
| > | Greater Than | The left value is larger | 8 > 3 |
| ≤ | Less Than or Equal To | Smaller than or exactly equal to | x ≤ 8 |
| ≥ | Greater Than or Equal To | Larger than or exactly equal to | x ≥ 8 |
| ≠ | Not Equal To | The values are different | 3 ≠ 8 |
A useful way to remember < and > is to imagine the symbol as an opening pointing toward the larger number. The narrow point faces the smaller number.
For example:
- 2 < 7 means 2 is less than 7.
- 7 > 2 means 7 is greater than 2.
- 5 ≤ 5 is true because the values are equal.
- 9 ≥ 4 is true because 9 is greater than 4.
- 6 ≠ 10 means 6 is not equal to 10.
The symbols ≤ and ≥ include an equality component. This small detail becomes especially important when you graph an inequality.
Inequality Symbols Definition
An inequality symbol is a mathematical notation used to express a relationship between two quantities where one may be greater, smaller, or different from the other.
For example:
x < 12
does not tell you that x has one specific value. Instead, it describes every value of x that is less than 12.
Similarly:
x ≥ 12
describes 12 and all values greater than 12.
Inequalities can be used with:
- Whole numbers
- Negative numbers
- Fractions
- Decimals
- Variables
- Algebraic expressions
- Real-world measurements
- Limits and ranges
The basic symbols can therefore describe both simple comparisons and more advanced mathematical conditions.
For example, a store might say that an item costs less than $50. This can be represented as:
price < 50
If a competition requires participants to be at least 18 years old, the condition can be written as:
age ≥ 18
The symbol turns a verbal condition into a concise mathematical statement.
Inequality Symbols And Meanings
Understanding what each symbol means is the foundation for solving and graphing inequalities.
Less Than <
The less-than symbol means that the value on the left is smaller than the value on the right.
4 < 9
This is read as “4 is less than 9.”
Because 4 is not equal to 9, the endpoint is not included when this relationship is represented on a number line.
Greater Than >
The greater-than symbol means that the value on the left is larger than the value on the right.
10 > 6
This is read as “10 is greater than 6.”
The value on the right is not included as an equal endpoint when the inequality is graphed.
Less Than or Equal To ≤
The symbol ≤ means that a value can be smaller than or exactly equal to another value.
x ≤ 7
The solution can include 7, 6, 5, 0, -2, and many other values less than 7.
Greater Than or Equal To ≥
The symbol ≥ means that a value can be greater than or exactly equal to another value.
x ≥ 7
The solution includes 7 and every value greater than 7.
Not Equal To ≠
The not-equal symbol means that two values are different.
x ≠ 7
This means x can be any value except 7.
The five symbols are related, but they should not be used interchangeably. In particular, < does not include equality, while ≤ does.
Inequality Symbols In Math
Inequality symbols are used throughout mathematics to describe ranges and restrictions. In algebra, they are especially useful because an inequality can have many possible solutions instead of one exact answer.
Consider:
x > 4
Possible solutions include 5, 6, 10, 100, and 4.5. The number 4 itself is not a solution.
Now compare it with:
x ≥ 4
Here, 4 is also a solution because the symbol includes equality.
Compound inequalities can describe a range between two boundaries:
2 < x ≤ 9
This means x is greater than 2 but less than or equal to 9.
So 2 is excluded, while 9 is included.
A Key Rule When Solving Inequalities
When adding or subtracting the same number from both sides, the inequality direction stays the same.
When multiplying or dividing both sides by a positive number, the direction also stays the same.
However, when multiplying or dividing both sides by a negative number, the inequality sign reverses.
For example:
-3x > 12
Divide both sides by -3:
x < -4
The symbol changes from > to <.
This rule is one of the most important differences between solving ordinary equations and solving inequalities.
Inequality Symbols Chart
A quick inequality symbols chart makes it easier to compare the signs at a glance.
| Symbol | Read As | Equality Included? | Example |
| < | Less Than | No | x < 5 |
| > | Greater Than | No | x > 5 |
| ≤ | Less Than or Equal To | Yes | x ≤ 5 |
| ≥ | Greater Than or Equal To | Yes | x ≥ 5 |
| ≠ | Not Equal To | No Equal Value | x ≠ 5 |
You can also connect mathematical symbols with common words:
| Phrase | Symbol |
| Less Than | < |
| Greater Than | > |
| At Most | ≤ |
| At Least | ≥ |
| No More Than | ≤ |
| No Less Than | ≥ |
| More Than | > |
| Fewer Than | < |
| Not Equal To | ≠ |
This vocabulary is especially useful in word problems because the wording often gives you the clue needed to choose the correct symbol.
Inequality Symbols With Examples
Examples make inequality symbols easier to recognize in real mathematical statements.
Example 1:
6 < 14
Six is less than fourteen.
Example 2:
14 > 6
Fourteen is greater than six.
Example 3:
x ≤ 20
x can be 20 or any value below 20.
Example 4:
x ≥ -5
x can be -5 or any value above -5.
Example 5:
x ≠ 3
x can be any value except 3.
Inequalities can also appear in practical situations.
Suppose a classroom has a maximum capacity of 30 students. If s represents the number of students, the condition is:
s ≤ 30
If a person must be at least 18 years old to enter an event:
age ≥ 18
If a package must weigh less than 10 kilograms:
weight < 10
These examples show how inequality notation can represent limits, minimums, maximums, and restrictions.
Inequality Symbols Number Line
A number line provides a visual way to show the solution set of an inequality. The boundary number is marked first, then the line or arrow extends in the direction of the values that satisfy the inequality.
For:
x < 4
place an open circle at 4 and shade to the left.
For:
x > 4
place an open circle at 4 and shade to the right.
For:
x ≤ 4
place a closed circle at 4 and shade to the left.
For:
x ≥ 4
place a closed circle at 4 and shade to the right.
The basic pattern is:
| Inequality | Circle | Direction |
| x < a | Open | Left |
| x > a | Open | Right |
| x ≤ a | Closed | Left |
| x ≥ a | Closed | Right |
This approach is consistent with standard inequality graphing: an endpoint is filled when equality is included, and the arrow points toward the values that satisfy the inequality.
For a compound inequality such as:
2 < x < 7
both endpoints are excluded, so the number line uses open circles at 2 and 7, with the section between them shaded.
Inequality Symbols Open Or Closed Circle
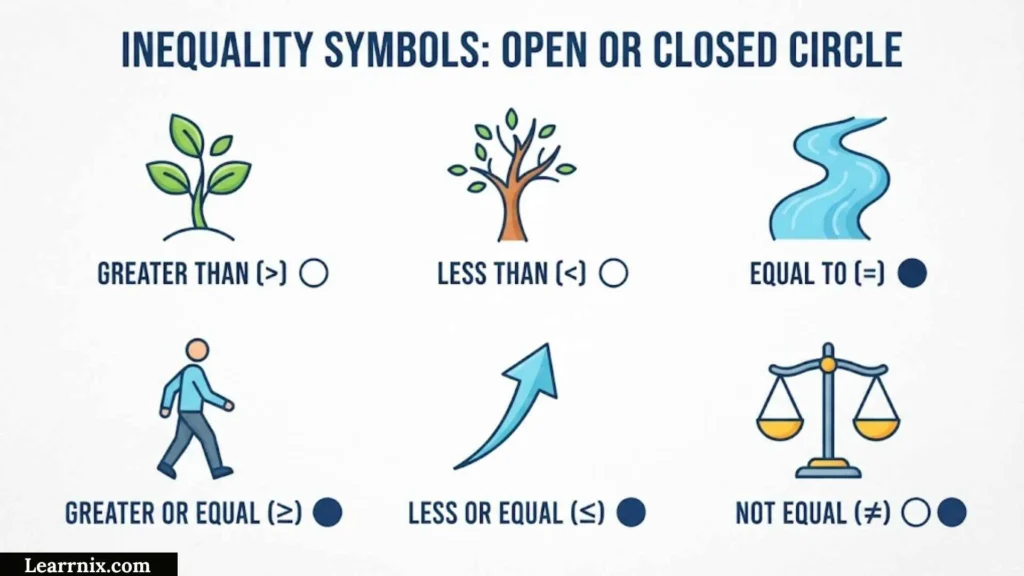
Open and closed circles show whether a boundary value belongs to the solution.
An open circle means the boundary value is not included. It is normally used with:
- <
- >
For example:
x > 6
uses an open circle at 6 because 6 itself does not satisfy x > 6.
A closed circle means the boundary value is included. It is used with:
- ≤
- ≥
For example:
x ≥ 6
uses a closed circle at 6 because 6 satisfies the inequality.
A simple way to remember the rule is:
Open circle = not included
Closed circle = included
The circle and the direction of shading provide two separate pieces of information. The circle tells you whether the endpoint is included, while the shading shows which side contains the solutions.
Inequality Symbols Shading
Shading identifies the numbers that satisfy the inequality.
For a simple inequality on a number line, the direction can be remembered as follows:
- < → shade left
- > → shade right
- ≤ → shade left
- ≥ → shade right
The difference between the paired symbols is the endpoint.
For example:
x < 8
uses an open circle at 8 and shading toward smaller numbers.
x ≤ 8
uses a closed circle at 8 and shading toward smaller numbers.
The direction is the same because both inequalities describe values below 8. The circle changes because only the second inequality includes 8.
Shading Compound Inequalities
Compound inequalities can have shading between two endpoints.
For:
3 < x < 9
use open circles at 3 and 9 and shade between them.
For:
3 ≤ x ≤ 9
use closed circles at both endpoints and shade between them.
For:
3 ≤ x < 9
use a closed circle at 3 and an open circle at 9.
Being precise about both endpoints prevents common graphing mistakes.
Inequality Symbols Graph
An inequality graph provides a visual representation of its solution set. For one-variable inequalities, this is commonly done on a number line. For two-variable linear inequalities, the graph is represented on a coordinate plane.
On a number line, the important features are the endpoint and shading direction.
For two-variable inequalities such as:
y > 2x + 1
the graph uses a boundary line and a shaded region. Since the inequality is strictly greater than, the boundary line is dashed because points directly on the line are not included.
For:
y ≥ 2x + 1
the boundary line is solid because points on the line are included. The appropriate side of the line is shaded to show the solutions.
This gives a useful connection between one-dimensional and two-dimensional graphs:
| Type | Excluded Boundary | Included Boundary |
| Number Line | Open Circle | Closed Circle |
| Coordinate Plane | Dashed Line | Solid Line |
When graphing a two-variable inequality, the shaded region represents the collection of coordinate pairs that satisfy the inequality.
Inequality Symbols At Most
The phrase “at most” means that a value can reach a certain maximum but cannot go above it.
The mathematical symbol for “at most” is:
≤
For example:
At most 25
becomes:
x ≤ 25
The value 25 is allowed, as are values below 25.
Other examples include:
- At most 10 items → items ≤ 10
- At most $500 → cost ≤ $500
- At most 40 students → students ≤ 40
- At most 3 hours → time ≤ 3
This phrase is often confused with “less than.”
Less than 25:
x < 25
At most 25:
x ≤ 25
The difference is whether 25 itself is allowed.
Other useful phrases follow the same pattern. “At least” means ≥, while “no more than” generally means ≤. Standard algebra resources use these verbal phrases as direct translations of inequality relationships.
Inequality Symbols Copy And Paste
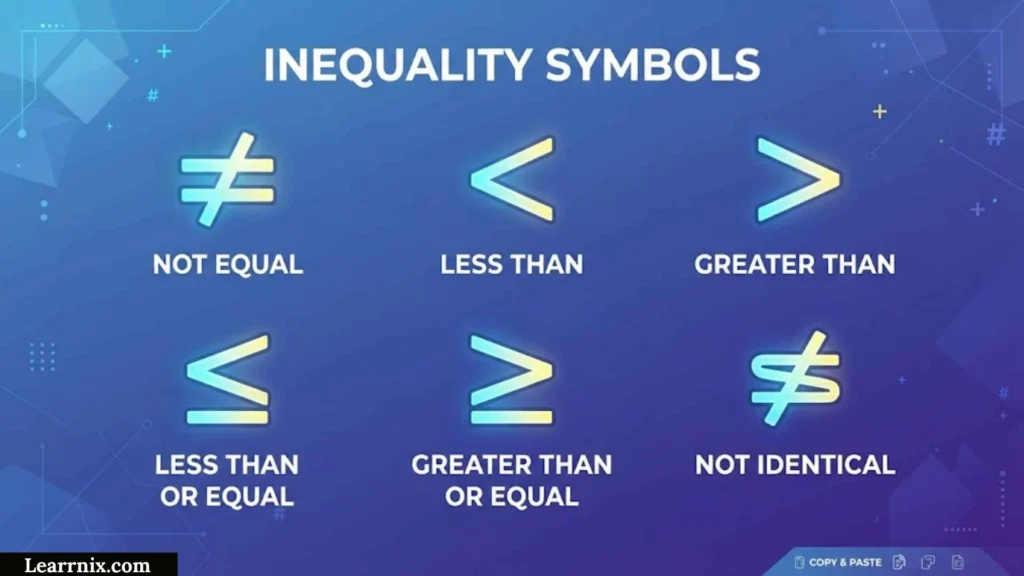
If you need inequality symbols for a worksheet, document, website, message, social media post, or math notes, you can copy them directly from the list below.
Basic Inequality Symbols
- < — Less Than
- > — Greater Than
- ≤ — Less Than or Equal To
- ≥ — Greater Than or Equal To
- ≠ — Not Equal To
Copy And Paste Inequality Examples
- x < 10
- x > 10
- x ≤ 10
- x ≥ 10
- x ≠ 10
- 2 ≤ x < 8
- 5 < x ≤ 12
- a ≠ b
The characters ≤, ≥, and ≠ are especially useful when you need the actual mathematical signs rather than typing a longer phrase such as “less than or equal to.”
If you are preparing plain text, the actual characters are convenient to copy. For more advanced mathematical documents, an equation editor or mathematical markup can provide additional formatting options.
How To Type Inequality Symbols
The < and > symbols are available on most standard keyboards. They are commonly found on keys shared with comma and period characters.
The symbols ≤, ≥, and ≠ are different because they are not usually available as dedicated keys on a standard English keyboard. For quick typing, copying the characters is often the simplest option:
≤
≥
≠
Many word processors and mathematical applications also provide an Insert Symbol feature or an equation editor. The exact keyboard shortcut varies by operating system, application, and keyboard layout, so it is better to use the method supported by the software you are working in rather than assuming one shortcut works everywhere.
For web pages and technical documents, mathematical markup can also be used when precise structure and accessibility are important. For ordinary notes, messages, and basic content, copying the Unicode characters is usually enough.
FAQ
What are the main inequality symbols?
The main inequality symbols are <, >, ≤, ≥, and ≠. They represent less than, greater than, less than or equal to, greater than or equal to, and not equal to.
Which inequality symbol means at most?
The symbol ≤ means “at most.” It allows the value to be equal to the stated number or smaller. For example, x ≤ 20 means x can be 20 or any smaller value.
When do you use an open circle on an inequality graph?
Use an open circle when the endpoint is not included in the solution. This normally occurs with < and > inequalities, such as x < 5 or x > 5.
When do you use a closed circle on a number line?
Use a closed circle when the endpoint is included. This occurs with ≤ and ≥, such as x ≤ 5 or x ≥ 5.
What happens to an inequality sign when you divide by a negative number?
The inequality sign reverses when both sides are divided or multiplied by a negative number. For example, dividing -2x > 8 by -2 gives x < -4.
Conclusion
Inequality symbols make it possible to describe comparisons, limits, ranges, and conditions with concise mathematical notation. The symbols <, >, ≤, ≥, and ≠ each communicate a different relationship, so choosing the correct sign is essential when reading or writing an inequality.
Graphs make these relationships easier to understand visually. On a number line, open and closed circles show whether an endpoint is excluded or included, while shading identifies the values that satisfy the inequality. In coordinate-plane graphs, dashed and solid boundary lines serve a similar purpose for two-variable inequalities.
For quick reference, remember the core pattern: < and ≤ point toward smaller values, while > and ≥ point toward larger values. Keep the copy-and-paste chart available when you need the actual symbols, and pay special attention to words such as “at most,” “at least,” “no more than,” and “no less than” when translating word problems into mathematics.

I am Charlotte Anderson, an education writer who is passionate about creating meaningful learning resources for students and lifelong learners.
I enjoy researching new educational approaches and sharing ideas that make studying easier and more effective.
Through my work, I aim to inspire curiosity, confidence, and a love for learning.
Books:
- The Complete Guide to Better Learning
- Building Skills for Academic Success
 Michael Carter